diagrams1-7 were my first attempts at graphic notation. the methodology i developed for drawing them was based on my interest in the tension between intuition and randomness.
for each diagram i followed the 3 steps below:
- set the aspect ratio of the diagram. {i set the aspect ratio of all the 7 diagrams to be 22×9.}
- select random values for the following parameters:
- the number of graphic elements {1 to 6}
- the types of graphic elements {lines/curves, points/circles/ellipses, triangles, rectangles, free geometric shapes, and traced photos.}
- the colors to be used {1 of Adobe Illustrator’s 10 “pop art” libraries (each contains 3-6 different colors). each library was used only once. opacity was used freely.}
- the initial time to spend on drawing {30 to 90 minutes}
- draw the diagram intuitively.
below are the values selected for each diagram. see also diagrams1-7.
diagram1
graphic elements: lines/curves, points/circles/ellipses, triangles, rectangles, free geometric shapes
colors: pop art 1
time: 62min
diagram2
graphic elements: points/circles/ellipses, free geometric shapes
colors: pop art 9
time: 86min
diagram3
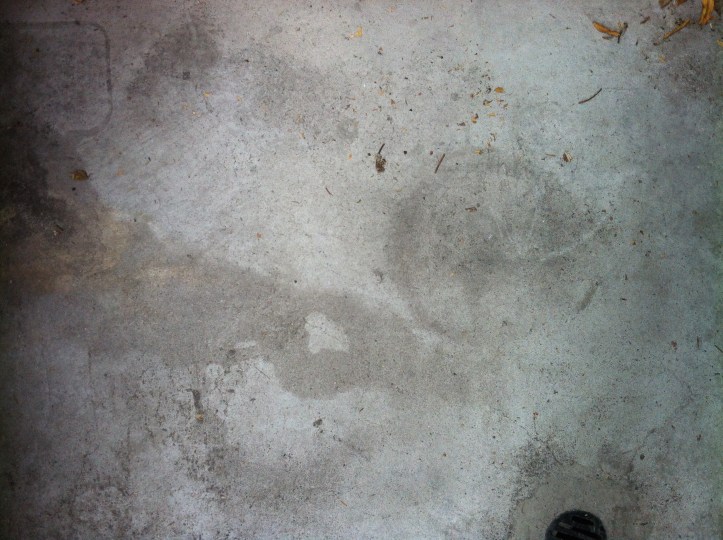
graphic elements: lines/curves, points/circles/ellipses, triangles, traced photos (pre-diagram3)
colors: pop art 6
time: 76min
diagram4
graphic elements: triangles, rectangles, free geometric shapes
colors: pop art 5
time: 59min
diagram5
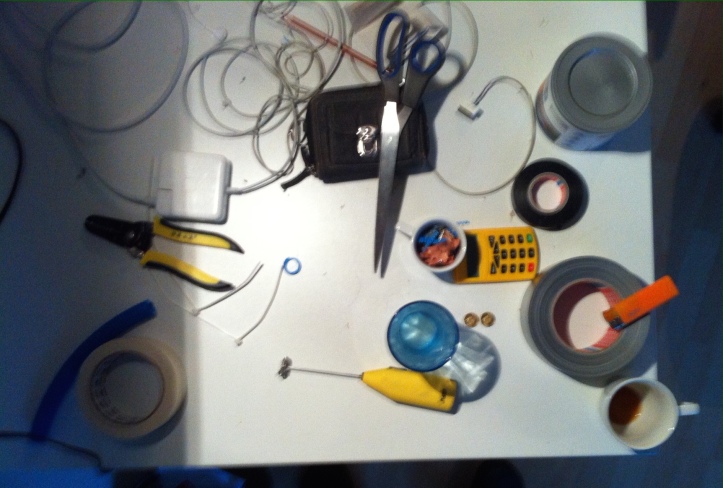
graphic elements: lines/curves, points/circles/ellipses, rectangles, traced photos (pre-diagram5)
colors: pop art 3
time: 50min
diagram6
graphic elements: rectangles, traced photos (pre-diagram6)
colors: pop art 8
time: 90min
diagram7
graphic elements: lines/curves, points/circles/ellipses, triangles, rectangles, free geometric shapes
colors: pop art 4
time: 83min
pre-diagram3
(the floor of my balcony)
pre-diagram5
(my table)
pre-diagram6
(the ceiling of my balcony)


